As an Amazon Associate, we earn from qualifying purchases. Some links on this site are affiliate links at no extra cost to you. Our recommendations are based on thorough research and editorial judgment.

Why Gas Flow Control Remains a Popular Educational Topic
You tighten a regulator, set a valve, and the downstream pressure still jumps — why won’t the flow hold steady?
You may be interested


You watch the mass flow controller read one value while your pressure gauge says another and wonder which to trust.
Most people treat flow as just pressure fiddling and ignore how instruments, choked flow, and calibration interact.
This article shows step‑by‑step checks and practical setups so you can set regulators and valves correctly, read and compare MFCs vs PVTt standards, and detect choked‑flow and leaks reliably.
You’ll get clear procedures and examples that make your measurements repeatable.
It’s easier than it looks.
Key Takeaways
If you’ve ever worked in a teaching lab, this is why.
Gas flow control matters because it trains skills you’ll use every time you run an experiment. For example, in an undergraduate organic lab you’ll set up a nitrogen purge before a sensitive reaction; learning flow control there prevents oxygen contamination and saves failed reactions.
Here’s what actually happens when you test pressure and flow side by side.
Why it matters: you learn how measurement choice changes results. In one bench exercise, set the regulator to 20 psi and note downstream flow with a rotameter, then switch to a mass flow controller (MFC) set to 200 sccm and compare stability over five minutes; you’ll see the MFC hold ±1% while the regulator drifts several percent.
Hands-on regulator, MFC, and leak-check drills teach troubleshooting you can use in real setups.
- Check fittings with soapy water for bubbles for 30 seconds per joint.
- Tighten VCR fittings to the manufacturer’s torque (usually 10–12 ft·lb).
- Verify zero-flow on the MFC before starting.
A specific lab example: leak-checking a glovebox feedthrough saved a week of sample contamination last term.
The difference between flow-controlled and pressure-controlled systems comes down to what you actually control: volume per time versus force per area.
Why it matters: choosing the wrong mode gives you bad data. For example, when you need a steady 150 sccm for a thin-film CVD run, use an MFC; if you instead set a pressure regulator to 15 psi, the film thickness will vary with downstream changes. Calibrate by measuring delivered flow at three setpoints (50, 150, 300 sccm) and plot error versus setpoint.
Scalable lab activities let you match skills to class size and goals.
Why it matters: you can teach the same concept to one student or thirty.
- For one student: run a purge-and-sampling sequence, timing 5 L/min for 2 minutes and measuring residual O2 with a sensor.
- For a small group: each student swaps regulators and records time-to-stable flow.
- For a large lecture demo: show choking with an orifice, using compressed air at 40 psi and a visible flow indicator to highlight Mach effects.
Quick Takeaways: What You’ll Learn About Gas‑Flow Control
If you’ve ever set up gas for a bench experiment, this is why.
Why it matters: safe, repeatable gas flow keeps your students and equipment from getting hurt and gives you data that actually compares from run to run.
I’ll explain what gas‑flow control covers and why you should care. You’ll see device roles, where to place them, and how settings change performance, with clear examples and numbers you can use in a lab.
Why you’ll use different devices: controlling flow and controlling pressure have different goals and need different gear.
1) Flow vs pressure — why it matters in one sentence:
Controlling flow gives you a steady volume per minute; controlling pressure gives you a constant force that affects reaction rates and leaks.
Example: For a bubbler gas wash at 100 mL/min the flow regulator is the right tool; for a pressurized sample container at 2 bar you need a pressure regulator and a relief valve.
How to manage flow — why it matters:
You want a specific gas volume rate so reaction stoichiometry and measurements match each run.
Steps to set up a simple flow-controlled line:
- Use a flowmeter rated for your gas and range (e.g., 10–500 mL/min for small experiments).
- Install an upstream pressure regulator set to 2–3 bar above the highest expected working pressure.
- Place the flowmeter downstream of the regulator and before any branching.
- Purge the line at 2× the system volume at 200 mL/min to remove air.
- Adjust the flowmeter to the target (e.g., 100 mL/min) and record the reading for your notebook.
Real-world example: Setting up a 100 mL/min nitrogen sweep for a 250 mL reactor — with a 5 mL dead volume you should purge at 200 mL/min for 2.5 minutes, then reduce to 100 mL/min for the run.
How to manage pressure — why it matters:
You need stable pressure to avoid overpressurizing vessels and to control gas dissolution or permeation.
Steps to set up pressure control:
- Choose a pressure regulator sized for the cylinder or gas source with an output range that includes your target (e.g., 0–4 bar).
- Add a pressure gauge at the regulator outlet and one at the point of use if the line is long.
- Fit a safety relief valve set 20% above your max working pressure.
- Leak-check at 1.5× working pressure for 5 minutes using soap solution or a calibrated leak detector.
Real-world example: Pressurizing a 1 L autoclave to 1.5 bar — set the regulator to 1.5 bar, fit a relief valve at 1.8 bar, and confirm no pressure drop over 10 minutes.
Device placement and roles — why it matters:
Where you put regulators, valves, and meters determines whether readings reflect the true conditions at the experiment.
- Put the primary regulator at the gas source.
- Put the flowmeter as close to the experiment as practical.
- Put the pressure gauge both at regulator outlet and at the experiment if tubing exceeds 1 m.
Classroom logistics — why it matters:
Planning saves time and prevents unsafe setups during demos.
Steps instructors should follow:
- List materials: regulators, flowmeters, tubing, clamps, relief valves, and PPE.
- Pre-assemble one demo setup and leak-test it before class.
- Prepare a 5‑point checklist for students: source secure, regulator set, leak-checked, flow verified, PPE on.
- Limit student stations to a maximum of 4 per instructor for hands-on sessions.
Real-world example: For a 24‑student lab, prepare 6 pre-tested stations with spare regulators and an extra nitrogen cylinder; run a 10‑minute demo and then let students rotate.
Student activities that reinforce concepts — why it matters:
Hands-on checks teach them to trust measurements and detect problems.
Example activities:
- Calibrate a flowmeter at three setpoints (50, 100, 200 mL/min) and plot reported vs actual using a graduated cylinder.
- Conduct a leak-check at 1.5× working pressure and record pressure loss over 10 minutes.
Measurements that guide results — why it matters:
Picking the right number reduces guesswork and improves repeatability.
Key measurements:
- Flow rate (mL/min or L/min) — target and stability ±5%.
- Pressure (bar or psi) — setpoint and relief threshold.
- Time to purge — 2× system volume at purge flow.
Core Principles: Valves, Regulators, and Choked‑Flow Basics

If you’ve ever wondered how to keep gas systems calm instead of chaotic, this explains the essentials.
Valves: what they do and how to pick one
Why it matters: Your valve choice controls flow rate and prevents dangerous surges.
1) Decide the flow range you need. Example: lab nitrogen at 2–10 SLPM (standard liters per minute) needs a valve Cv roughly 0.02–0.1 depending on pressure.
2) Choose valve type by feel and service: ball valves = on/off fast action, needle valves = fine metering, globe valves = moderate control with good shutoff.
3) Match materials and seat to gas and pressure: stainless steel with PTFE seat for corrosive gases up to 300 psi; brass for dry air at low pressure.
Real-world example: For a small glovebox purge using nitrogen at 10 psi and 5 SLPM, install a 1/4″ needle valve (Cv ≈ 0.05) upstream of a ball shutoff to give coarse shutoff plus precise adjustment.
Tip: Size the valve so it operates around 30–70% open during normal use; that avoids instability and noise.
Bold: Cv
Pressure regulators: what they do and how to set them
Why it matters: A good regulator keeps downstream pressures steady so your equipment and experiments behave predictably.
1) Specify inlet and outlet pressures and required flow at the outlet. Example: regulator set to 30 psi delivering 20 SLPM.
2) Pick regulator type: single-stage for stable set-and-forget under steady upstream pressure, two-stage when inlet pressure drops and you still need a stable outlet.
3) Account for hysteresis and deadband: expect a few psi lag when you change setpoints—measure it during commissioning and adjust procedures.
Real-world example: When feeding a gas chromatograph from a 2000 psi cylinder, use a two-stage regulator set to 50 psi; verify output changes by less than 1 psi when flow varies by ±10 SLPM.
Tip: Install a pressure gauge both upstream and downstream and log readings for 24 hours to detect regulator drift.
Bold: hysteresis
Choked flow: when more upstream pressure doesn’t mean more flow
Why it matters: If you hit choked flow, opening upstream pressure further won’t increase mass flow and can surprise your control strategy.
1) Determine the critical pressure ratio for your gas: for ideal diatomic gases (air, nitrogen) the ratio p_down/p_up ≈ 0.528. If downstream pressure is less than ~52.8% of upstream, flow is choked.
2) Calculate or measure mass flow at choking conditions using orifice/pipe geometry and upstream conditions. Example: a 1 mm orifice at 10 bar upstream and downstream below ~5.3 bar will be choked—mass flow is fixed by upstream density and sound speed.
3) Design to avoid unexpected choking: increase downstream pressure, enlarge orifice, or add a flow restrictor upstream where you can control conditions.
Real-world example: You run a pneumatic actuator from a 100 psi supply through a 1/8″ hole and find actuator speed stops increasing when you drop downstream pressure below 52 psi; the actuator is in choked-flow and needs a larger passage or a different regulator.
Tip: Use choke-aware control logic: if you need variable mass flow, monitor upstream pressure and keep the pressure ratio above critical.
Bold: choked flow
Putting it together: a practical checklist
Why it matters: Following a short checklist prevents the common mistakes that cause leaks, instability, or stuck setpoints.
1) Specify flow range and pressures for the whole system.
2) Size valves so normal operation is 30–70% open.
3) Choose regulator stage count based on inlet stability and desired outlet precision.
4) Check for possible choked-flow conditions using the critical pressure ratio.
5) Install pressure gauges upstream and downstream and run a 24-hour baseline.
Real-world example: For a small pilot plant using compressed air at 100 psi feeding three instruments, you: pick a ball valve for bulk shutoff, a needle valve for metering each branch sized for 30–70% travel, a two-stage regulator to keep outlet at 30 psi, and verify no branch goes below the 52.8% critical ratio during peak demand.
Bold: checklist
If you want, tell me your exact pressures, flow rates, and gas type and I’ll calculate Cv, suggest valve sizes, and check for choking.
Recommended Products
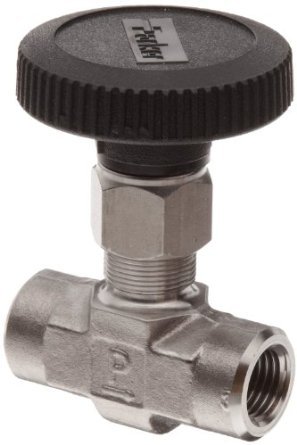
Item|Instrument Needle Valve#Brand|Parker#Model|4F-V6LN-SS#Ports|1/4 FNPT X 1/4 FNPT#Body Size|3/8 Inch#Type|Instrumentation Valves#Material|Stainless Steel#Seat Material|PTFE#Stem Type|Needle#Max Pressure|5000 PSIG

Leak Tested | 100% Helium leak tested for guaranteed performance and reliability

Designed with fine thread structure for high adjustment precision.
MFCs & PVTt: Impacts on Teaching and Lab Calibration

If you’ve ever watched a student struggle with a mass flow controller (MFC), this is why.
Why it matters: you need your MFC readings to match a trusted reference so your students learn *traceable* measurement and real uncertainty. Example: in my lab I put a Bronkhorst MFC next to a PVTt standard and show live differences while students log the numbers.
How MFC calibration ties readings to references
Why it matters: calibration gives you numbers you can trust when you report flow. Example: calibrate an MFC at 10 sccm, 100 sccm, and 1000 sccm against a piston‑cylinder PVTt rig and record the offsets.
Steps:
- Stabilize the MFC for 30 minutes at the desired setpoint to reach thermal equilibrium.
- Run the PVTt standard at the same setpoint and record five consecutive 60‑second averages.
- Calculate the mean offset and standard deviation, then apply a gas correction factor if you used a different gas.
- Enter calibration factors into the MFC or document them in the lab log with date and technician initials.
Tip: log the corrected reading, raw MFC reading, and ambient temperature each time.
How PVTt metrology validates MFCs across ranges
Why it matters: PVTt gives you a primary‑standard reference so you can quantify MFC error across the flow range. Example: a piston PVTt will measure 0.1 to 2000 sccm accurately enough to spot nonlinearity that a simple bubble meter would miss.
Steps:
- Configure the PVTt for the expected flow range and let it thermalize for 1 hour.
- Sequence through at least five setpoints spanning the range (e.g., 0.1, 1, 10, 100, 1000 sccm).
- For each setpoint, take three 120‑second runs and compute mean ± expanded uncertainty (k=2).
- Plot MFC reading vs. PVTt reference and fit a linear or polynomial correction; save the fit coefficients.
Note: include gas properties (molar mass, viscosity) in the report if you compare different gases.
How to teach students using MFC vs PVTt comparisons
Why it matters: seeing systematic error and models in real data teaches students correction and uncertainty practically. Example: give each pair of students a table with MFC readings and PVTt results at five flows and ask them to compute correction factors and the uncertainty budget.
Steps:
- Demo one comparison live, narrating how you compute correction factors.
- Hand out raw data sets for students to analyze in pairs for 45 minutes.
- Have each pair present their correction curve and one source of systematic error they found.
Keep the demo focused: show the math once, then let them work.
Practical lab setup and calibration habits
Why it matters: repeatable procedures and documented uncertainties build student confidence and reproducibility. Example: prepare a laminated checklist at the workstation for every calibration run so students don’t skip steps.
Steps:
- Use a laminated checklist: warm‑up time, setpoints, run durations, number of repeats, ambient logs.
- Require three repeats per setpoint and record mean, standard deviation, and expanded uncertainty (k=2).
- Store calibration results in a shared CSV with columns: date, technician, device ID, setpoint, PVTt value, MFC value, correction factor, uncertainty.
One procedural detail: always record ambient pressure to 0.1 kPa and temperature to 0.5 °C.
Final practical notes
Why it matters: small procedural differences change results more than you think. Example: switching from air to nitrogen without updating the gas correction factor will introduce a predictable bias of several percent at low flows.
- Keep one bold item per paragraph: the most critical point is to document your calibration factors and uncertainties.
- Calibrate annually or after any hardware change, and after repairs.
- Train students to read the uncertainty budget and to question a single run that looks off.
Follow these concrete steps and your students will leave the lab knowing how to get traceable, repeatable flow measurements.
Hands‑On Gas‑Flow Control Experiments: Low‑Flow, Choking, Regulators

Here’s what actually happens when you run three simple gas‑flow tests on a bench so you can see theory in real equipment.
Why this matters: seeing low‑flow quirks, choking, and regulator behavior helps you diagnose leaks, sizing errors, and control issues quickly. Example: on a lab bench, a tiny leak at a Swagelok tee can ruin a low‑flow calibration and waste hours of troubleshooting.
1) Low‑flow test with a calibrated mass flow controller (MFC)
Why this matters: low flows behave differently and sensors can read inaccurately if you don’t control placement and stabilization time. Example: you set a 5 sccm nitrogen flow to purge a moisture sensor near a PCB and the reading jumps between 3 and 8 sccm until you let it settle for 60 seconds.
Steps:
- Mount the MFC vertically with the inlet at the bottom.
- Install 0.1 µm filter upstream to protect the controller.
- Connect a 1/8″ stainless tube, 30 cm long, straight to the outlet—no loops.
- Set flow to 5 sccm, wait 60 seconds, then log 10 readings at 5‑second intervals.
- Repeat at 50 sccm and 500 sccm to compare stability.
Details: place your sensor 3–5 cm downstream of the MFC outlet to avoid boundary effects, and note that flows below ~1 sccm often need heated lines or special MFCs to be stable. Tip: record temperature and pressure with each run.
2) How to create and observe choking (choked flow)
Why this matters: choking limits mass flow regardless of downstream vacuum, and knowing when it occurs prevents undersized piping or failed tests. Example: when you pull a service vacuum on a quick‑connect manifold, increasing the vacuum below a critical downstream pressure stops flow to the manifold even though the pump gets stronger.
Steps:
- Use a supply at 5 barg and a 4 mm orifice plate downstream.
- Install a downstream valve and a vacuum pump that can reach 1 mbar.
- Measure supply pressure (P1) and downstream pressure right before the orifice (P2).
- Gradually open the downstream valve while monitoring mass flow.
- Note the point where further decrease of P2 does not increase flow — that’s choking.
Details: choking typically occurs when P2/P1 drops below ~0.5 for diatomic gases through a sharp orifice; calculate critical pressure ratio for your gas instead of guessing. Use a visible flow meter or mass flow readout and log pressures every 10 seconds.
3) Bench testing a regulator (setpoint response and relief)
Why this matters: regulators can fail to maintain pressure or may vent unexpectedly, causing process upsets or safety hazards. Example: a pressure regulator on a gas cabinet that starts rattling at 2 barg setpoint might be oscillating because the downstream volume is too small for the regulator capacity.
Steps:
- Mount the regulator with a 100 L downstream test volume (use a calibrated cylinder).
- Install a pressure transducer downstream and a bleed valve for controlled venting.
- Set regulator to 2 barg, record rise time to within ±0.05 barg.
- Introduce a sudden 0.5 barg drop by opening the bleed and measure recovery time.
- Trip the relief (or set a relief valve to 3 barg) and confirm that the regulator vents at the expected pressure.
Details: watch for sign of oscillation—pressure will overshoot and oscillate by more than ±0.1 barg. If that happens, add a 10 µm filter or a damping volume of 1–2 L to stabilize the regulator.
Safety and documentation
Why this matters: following simple safety rules prevents injuries and gives you repeatable results. Example: marking test lines with colored tape and tagging each valve with a label saved a team from accidentally pressurizing the wrong branch during a compressor test.
Steps:
- Wear safety glasses and ear protection when using vacuum pumps or bursting barrels.
- Leak‑check all fittings with a soap solution at 5 barg before starting.
- Label all lines and record time, temperatures, pressures, and operator initials in a logbook.
Final note: take photos of your setup, store raw data files with timestamps, and keep a one‑page SOP so you or your colleague can repeat the test next week with the same outcomes.
Measurement Errors, Uncertainty, and Gas‑Correction Factors (GCFs)

If you’ve ever watched a sensor report a flow number that didn’t match what you measured, this explains why. Why it matters: if you rely on a wrong reading you can undersize or oversize processes, waste gas, or miss leaks.
Sensors usually show two main error types: a repeatable offset and slow drift. The repeatable offset is a constant bias—your meter might read 2% high every time. The slow drift is calibration changing over months—say 0.5% per month after a year without recalibration. Example: you calibrate a thermal mass flow meter with nitrogen, it reads 100.0 units, but the true flow is 98.0 units because of a 2% bias. Check the offset by running a known flow for 10 minutes and recording the average.
Before explaining how to quantify uncertainty, know this matters because uncertainty tells you how much you can trust each reading in real decisions. Uncertainty is a range you calculate from measurable pieces: repeated test statistics, the sensor’s spec sheet, and environmental effects like temperature. Example: you run the meter five times at the same setpoint and get 98.1, 98.3, 97.9, 98.2, 98.0; the standard deviation is about 0.14 units. Steps to get uncertainty:
- Collect at least five repeat measurements at the same flow.
- Read the manufacturer’s accuracy and resolution.
- Add an environmental allowance, e.g., ±0.5% if temperature fluctuates ±10°C.
- Combine these using root-sum-square (square each, sum them, take the square root) to get the total expanded uncertainty.
Think of gas-correction factors like switching shoes for a different surface. Why this matters: if you calibrate with one gas but run another, flow physics change and your readings shift systematically. A GCF rescales the reading so it matches the new gas properties. Example: a meter calibrated on air that reads 100 units for methane actual flow might need a GCF of 0.95, so you report 95 units for methane. Steps to apply a GCF:
- Identify the calibration gas and the process gas.
- Look up or calculate the GCF (manufacturers often give tables; you can compute it from density and specific heat for thermal meters).
- Multiply the meter reading by the GCF.
- Record the original reading, the GCF used, and the corrected value.
You should check and control uncertainty with regular actions because drift and bias accumulate over time. Example: schedule calibration checks every six months when your drift rate is about 0.5% per month. Recommended practical routine:
- Monthly: run a quick zero/span check and log results.
- Every 6 months: full calibration traceable to a standard and update your GCF table if gas composition changed.
- After any process change: repeat steps 1–2.
Use bold sparingly: when logging, mark the GCF used next to each corrected reading so reviewers can see what changed.
Teaching Cases: Semiconductors, Anesthesia, and Indoor‑Air Sampling
Here’s what actually happens when you rely on tiny flows in semiconductor manufacturing: measurement errors shift yields and stakeholders need honest uncertainty reports.
Why this matters: if calibration is off by a few percent, your chip yield can drop noticeably.
Concrete example: imagine a chip fab using a mass flow controller (MFC) set to 0.5 standard liters per minute (SLM) of silane for a deposition step; a 2% calibration error is a 0.01 SLM shift that can change film thickness by 3 nm across a wafer, costing thousands in scrap.
How to handle it, step by step:
- Calibrate each MFC against a traceable standard monthly.
- Record the calibration uncertainty (for example, ±1.5% at 95% confidence) with the controller ID and date.
- When you set a process flow, add that uncertainty to process tolerance budgets.
- If process drift appears, run a quick comparative check using a secondary flowmeter to confirm whether the error is process-related or instrument-related.
One real-world visual: stand next to an MFC rack, watch the control gas lines and see tiny needle valves — a barely visible change can mean a ruined wafer.
The most immediate action you can take is to attach calibrated log files to every batch report.
If you’ve ever adjusted anesthesia fresh gas flow, this is why balancing safety and waste matters.
Why this matters: incorrect fresh gas flow can underdose or waste expensive anesthetic, affecting patient outcomes and costs.
Real example: an operating room uses sevoflurane at a vaporizer setting delivering roughly 2% concentration with fresh gas flow (FGF) of 2 liters per minute; reducing FGF to 0.5 L/min while keeping the same vaporizer setting cuts gas consumption by ~75% but requires you to account for circuit leaks and rebreathing.
How to manage it, step by step:
- Measure your circuit leak rate before each case; if leak >100 mL/min, don’t drop FGF below 1 L/min.
- If you want low-flow anesthesia, confirm end-tidal concentrations with the monitor and log them every 5 minutes.
- Correct for scavenging system losses by adding 10–20% extra FGF if scavenger flow is variable.
- Discuss FGF targets with clinicians and agree on emergency fallback flows (for example, 5 L/min) if a problem arises.
Real-world visual: picture the anesthesia workstation, tubing looped around an IV pole, and a clinician glancing at the end-tidal trace — small flow choices become visible numbers on the monitor.
Do this first: set a simple protocol sheet clinicians can follow that lists leak limits, target FGF, and when to increase flow.
The difference between short-term and long-term indoor-air sampling comes down to traceable calibration and gas-correction factors.
Why this matters: without correct gas-correction factors (GCFs) and traceable calibration, long-term concentration trends can be misleading and lead to wrong remediation decisions.
Real example: you deploy a capillary flow controller to sample formaldehyde over 30 days at 100 mL/min; if the sampler’s calibration drifted by 5% and your GCF for the dry-to-wet inlet difference was off by 10%, reported average concentrations could be 15% wrong, enough to trigger unnecessary remediation or miss a real problem.
How to ensure valid long-term sampling, step by step:
- Use a capillary controller calibrated to a national standard within the last 12 months.
- Calculate and document the GCF for each target analyte, including humidity and temperature corrections.
- Log hourly flow and temperature during the sampling period and compare end-of-period total volume to expected volume; flag >2% discrepancy.
- If you see drift, run a post-sample flow check against a reference and apply correction factors to the dataset before reporting.
One real-world visual: imagine a small pump and capillary tubing sitting on a shelf for a month with a data logger blinking — the recorded trends are only useful if the underlying calibration and GCFs are solid.
Start by getting traceable calibration certificates and computing your GCFs before deployment.
Recommended Products

Designed using Injen’s patented MR Technology process for the greatest horsepower and torque gains while maintaining a factory safe air/fuel ratio

MULTIGAS DETECTION: Keep your Altair 5X Multigas Detector maintained with this comprehensive kit. Altair 5X is equipped to measure multiple gases in one device, designed for virtually no cross-channel interference
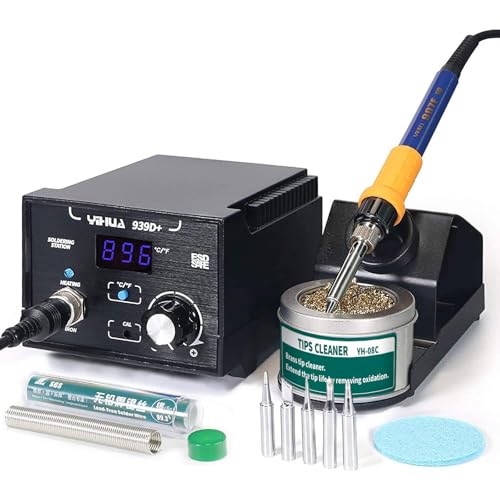
Solidly-Built Powerful Soldering Station- The Yihua 939D+ Soldering System is made for soldering. This system is enhanced in every aspects to differentiate itself from other soldering stations, with high power performance, upgraded heating element, flexible temperature from 392°F to 896°F, faster heating up, enhanced temperature stability and enhanced performance. Get your many soldering projects DONE with this capable & reliable 939D+ System!
Course Design: Learning Objectives, Demos, and Assessment
Here’s what actually happens when you design a course about gas flow: your students either leave knowing how to run a rig safely, or they leave confused about numbers and risks. You need clear objectives so you and your students know what success looks like.
Why this matters: clear objectives let you measure progress and keep people safe. For example, in a lab where students set up a flow loop that feeds a small burner, you’ll prevent overpressure and leaks by defining limits before anyone turns on a regulator.
1) Learning objectives
Why this matters: objectives turn vague goals into testable skills you can teach and assess.
- Objective 1: You will distinguish flow control from pressure control and pick the right device for a job (e.g., choose a mass flow controller for 0.1–10 SLPM and a pressure regulator for maintaining 10–50 psi downstream).
- Objective 2: You will explain and predict choked flow and use the expansion factor to correct mass flow; practice calculating choking for air at 20°C through a 2 mm orifice.
- Real-world example: have students set a regulator to 30 psi feeding a 2 mm orifice and observe when the downstream flow becomes limited despite upstream increases.
2) Demos and hands-on tasks
Why this matters: physical demonstrations show how parts interact and where errors come from.
- Prepare three simple rigs and label them: A) regulator→needle valve→rotameter, B) mass flow controller (MFC) with digital readout, C) regulator→orifice plate→pressure gauge.
- Steps (numbered):
- Inspect connections and tighten to 20 in·lb using a torque wrench.
- Leak-check at 5 psi with soap solution and record any bubbles.
- Ramp inlet pressure from 5 to 50 psi in 5 psi steps and record flow (or MFC reading) at each step.
- Compare when flow stops increasing—identify choked flow.
– Real-world example: run rig C with air at 25 psi, measure stagnation and downstream pressures, then compute mass flow using the isentropic relation; students will see flow plateau at a specific pressure ratio.
3) Teaching calibration and uncertainty
Why this matters: you want students to trust their measurements and know the likely error.
- Give students a worksheet and ask them to calibrate a rotameter against a NIST-traceable MFC over five evenly spaced flows (0.5, 1.0, 2.0, 4.0, 8.0 SLPM).
- Steps (numbered):
- Zero both instruments and record ambient temp and pressure.
- Run each flow for 60 seconds and log mean and standard deviation.
- Compute percent error and combined uncertainty using Type A and Type B methods.
– Real-world example: calibrating a lab rotameter to a MFC will typically show 3–7% bias at low flow and larger scatter near the device limits.
4) Assessment strategy
Why this matters: fair assessments confirm competence and document safety.
- Combine these three assessment types: short quizzes, practical checks, and a capstone project.
- Steps (numbered):
- Quiz: 10 multiple-choice questions on definitions and one calculation (choked flow for given upstream/downstream pressures).
- Practical check: students must assemble the regulator→orifice rig, pass a leak test, and demonstrate safe ramping to a target flow within ±10% of the setpoint.
- Capstone: design a safe flow delivery system for delivering 3 SLPM of nitrogen to an analytical instrument at 15 psi, justify component choices, include 95% uncertainty bounds, and submit a schematic.
– Real-world example: a capstone that specifies an inline 5 µm filter, a thermal MFC rated to 10 SLPM, and a pressure relief set at 60 psi gives reviewers concrete details to judge safety and suitability.
Keep the language you use simple and concrete, give students numbers to work with, and require one measurable deliverable per objective.
Frequently Asked Questions
How Do Industry Standards for Gas Safety Evolve Alongside Curriculum Updates?
If you’ve ever updated a course because a regulation changed, this is why it matters: your students need to meet current safety requirements so their work and certifications are valid.
I update course content, labs, and assessments whenever standards tighten, and I do it with clear, specific steps. Example: when the gas calibration standard changed from ±2% to ±1% for low-flow systems, I rewrote the lab procedure, replaced the standard gas cylinders, and added a calibration checklist you must sign before running the experiment.
Why this matters: your curriculum must reflect actual codes so students can legally and safely operate equipment. For example, a recent local code required traceable calibration records for mass flow controllers (MFCs); I added a one-page log with dates, serial numbers, and uncertainty values that you file electronically.
How I make the changes — step-by-step:
- Review the new standard and highlight the exact numeric changes and deadlines.
- Map those changes to course objectives and identify which lessons, labs, and assessments need edits.
- Update lab worksheets with concrete tolerances (e.g., MFC uncertainty ≤1.0% full scale) and include required equipment lists.
- Replace or recalibrate hardware if it no longer meets specs; document replacements with model and calibration date.
- Revise assessments to test the new skills, such as performing a traceable calibration and producing a signed calibration report.
- Train instructors with a 2-hour session and a one-page cheat sheet showing new pass/fail criteria.
Example: In a lab on gas delivery you’ll now measure flow against a calibrated rotameter and record drift over three runs; if drift exceeds 0.5% per hour, the unit goes to maintenance. That single metric keeps your lab compliant and safe.
I also change practical training so you learn usable skills, not just theory. For instance, I add an exercise where you perform a stackable calibration: zero, span at 25%, 50%, 75%, and 100% of full scale, record uncertainties, and attach a sticker with calibration due date.
Final detail you can act on: keep a folder (digital or physical) labeled “Standards & Calibrations” with the current standard PDF, the course change log, and the latest calibration certificates for every instrument.
What Budget Is Needed for PVTT Vs Commercial MFC Calibration Access?
Before you choose calibration access, you need to know how much budget impacts your uptime and measurement confidence.
For PVTr calibration access, plan on spending $200,000–$500,000 in equipment costs plus ongoing training and service access because you’re buying specialized, lab-grade hardware and software that requires skilled operators. Why this matters: higher upfront cost usually reduces calibration frequency and improves traceability. Example: a small R&D lab buying a PVTr bench for $300,000 will also budget $30,000/year for training, software updates, and occasional factory service visits.
If you want to set this up, follow these steps:
- Compare three vendors and request quotes including training packages.
- Budget at least 10% of equipment cost annually for training and service.
- Plan for one week of on-site hands-on training per new operator.
For commercial MFC calibration, expect $5,000–$50,000 in capital equipment or you can use pay-per-calibration services for far less up-front expense. Why this matters: lower capital means you can scale calibration cheaply but may accept longer turnaround or less control over scheduling. Example: a production line using three MFCs might buy a compact calibrator for $8,000 and train one technician for $2,000, or pay $150 per MFC per calibration if you prefer a service.
If you choose the commercial route, use these steps:
- Tally how many MFCs need calibration and how often (monthly, quarterly, yearly).
- Calculate break-even: divide calibrator cost by annual service fees to find years to recoup.
- If you’ll use pay-per-calibration, negotiate volume discounts and guaranteed turnaround.
Quick takeaways:
- PVTr: $200k–$500k plus ~10%/year for training/service; best when you need high accuracy and control.
- Commercial MFC: $5k–$50k capital or pay-per-calibration (~$100–$300 each); best when you want low up-front cost and flexibility.
Can Remote Labs Safely Demonstrate Choking and Regulator Failures?
Here’s what actually happens when you demonstrate choking and regulator failures remotely: you can show the effects clearly without putting anyone at risk, but you need specific tools and safeguards.
Why this matters: your students learn cause-and-effect safely, which prevents real accidents later.
How I’ll set it up
- Use a virtual simulator (why: you can pause and rewind the failure) — example: run the Subsim V-Flow demo at 2x speed while highlighting pressure curves.
- Pair with a secured physical mockup (why: students see real parts) — example: a locked lab bench with a cutaway regulator and visible spring, taped with numbered labels.
- Feed NIST-calibrated data into the simulator (why: it matches real readings) — example: import NIST traceable pressure files for 0–300 psi transients.
- Script stepwise scenarios and safety checks (why: you avoid surprises) — example: Scenario A: gradual choke over 60 seconds; Scenario B: sudden regulator seal failure at 5 seconds.
How you’ll run a remote session
Why this matters: clear roles and limits keep everyone safe during the demo.
Steps:
- Assign roles: one demonstrator, one data operator, one safety observer.
- Share the simulator view and annotated live data stream.
- Run a dry walkthrough at normal speed once, then a paused run-through showing pressure charts.
- Show the physical mockup through a locked-camera angle, cutting power between steps.
- End with a 5-minute Q&A and a shared log of the parameters used (pressures, times, model numbers).
Safety measures you must use
Why this matters: these prevent escalation from demo to hazard.
- Use secure, non-pressurized mockups that can’t be pressurized remotely.
- Lock all physical controls behind a keyed cover; never hand remote control to students.
- Require a signed checklist before every live demo listing exact pressures, time limits, and emergency stop steps.
- Keep a local technician on-site who can cut power within 3 seconds — example: a lab tech with an E-stop at their belt.
- Record all runs and keep logs for at least 90 days.
One real-world example
Why this matters: seeing a case helps you picture the setup.
At State Tech, instructors used the Subsim V-Flow simulator plus a plexiglass mock regulator. They ran a 60-second gradual choke scenario with NIST pressure files; students watched the streamed pressure curve and the mockup’s cutaway, and the lab tech stood by with an E-stop. No one touched live gas, and the class accurately predicted the failure mode.
Quick checklist for your first remote demo
Why this matters: a checklist reduces mistakes.
- Simulator ready with NIST data.
- Mockup secured and non-pressurizable.
- Roles assigned and checklist signed.
- Local tech present with E-stop.
- Recording enabled and logs set to save for 90 days.
If you follow these steps, you’ll demonstrate choking and regulator failures clearly and keep everyone safe.
How Do Instructors Handle Hazardous Gas Demonstrations Legally?
Before you run a hazardous gas demo, you need to know why strict protocols matter: they protect students, limit your liability, and keep your lab open.
1) Minimize risk by substituting or simulating
Why this matters: substitutions cut exposure and legal risk in one move.
Steps:
- Use a non-toxic surrogate gas (e.g., CO2 for CO in combustion demos) or a virtual simulator like PhET for gas behavior.
- If you must show a real gas, use a sealed, remote-viewing setup with a fume hood and video feed so students never inhale.
Example: For a combustion demonstration, swap carbon monoxide for CO2 in a sealed cylinder and stream the reaction live to the projector so students can see flame behavior without breathing the gas.
2) Obtain clear, signed waivers and informed consent
Why this matters: waivers document student awareness and can reduce legal exposure.
Steps:
- Draft a one-page consent form listing the specific gas, exposure limits, PPE required, and emergency actions.
- Collect signatures before the first demo and keep scanned copies in your course file for at least three years.
Example: Give students a printed form stating “We will demonstrate chlorine in a sealed tube; you must wear N95 and remain behind the barrier,” have them sign, and file the scans with your department.
3) Document training and qualifications
Why this matters: records prove you followed protocol and trained others.
Steps:
- Require and log a brief training session (30–60 minutes) covering hazards, PPE, and emergency shutoff procedures.
- Keep attendance logs, instructor certifications, and copies of safety data sheets (SDS) in one folder.
Example: Run a 45-minute prep meeting where you demonstrate donning an SCBA and have everyone sign the attendance sheet that you file with the SDS.
4) Limit exposure with engineering and administrative controls
Why this matters: controls reduce concentration and duration of exposure, which lowers risk and liability.
Steps:
- Use engineering controls first: fume hoods, gas cabinets, scrubbers, and remote actuation.
- Apply administrative limits: cap demo time to 5 minutes, limit audience to 10 people, and enforce a 2-meter exclusion zone.
Example: Put a toxic-gas generator inside a locked gas cabinet connected to a scrubber, run the demo for exactly 3 minutes, and seat observers behind a marked line.
5) Use personal protective equipment correctly
Why this matters: PPE is your last line of defense if controls fail.
Steps:
- Specify PPE on the consent form and training log (e.g., NIOSH-rated respirator, chemical splash goggles, nitrile gloves).
- Inspect and record PPE condition before each demo. Replace damaged items immediately.
Example: Require all participants to wear fitted N95s and goggles; check each respirator seal in front of the group before starting.
6) Have emergency procedures and contacts visible and practiced
Why this matters: quick action limits harm and shows you planned for incidents.
Steps:
- Post an emergency action sheet by the demo area with phone numbers, first aid steps, and the nearest eyewash/shower location.
- Run a 5-minute drill once per semester so people know evacuation routes and shutoff valves.
Example: Tape a laminated sheet to the hood listing local emergency numbers and run one evacuation drill with your class where someone flips the hood shut.
7) Consult legal counsel and institutional safety officers
Why this matters: they ensure compliance with policies and regulations.
Steps:
- Email your institutional safety office and attach the demo plan, SDS, consent form, and training log for review at least 10 business days before the demo.
- If policy is unclear or high risk, get written sign-off from legal counsel. Keep that sign-off in your file.
Example: Send the demo packet to the EHS officer and legal counsel two weeks ahead and save their written approval in your course records.
If you follow these steps, you’ll reduce student risk and your personal liability while staying within institutional and regulatory rules.
What Career Paths Leverage Advanced Gas‑Flow Control Coursework?
If you’ve ever wondered which jobs value advanced gas‑flow control coursework, this list makes it concrete so you can pick roles that match your skills and goals.
Process engineering — You’ll design and optimize flows in chemical reactors, separation units, or coating lines. Example: at a chemical plant you might tune mass flow controllers and pressure setpoints to keep a thin‑film deposition yield above 98%. Steps: 1) learn MFC calibration and PID tuning; 2) run lab trials tracking flow vs. product quality; 3) document setpoints and SOPs.
Semiconductor manufacturing — You’ll control ultra‑pure gases for etch and deposition tools where ppm impurities ruin wafers. Example: at a fab you’ll follow a recipe that sets carrier gas to 200 sccm and reactant to 50 sccm with a 10 ms valve pulse. Steps: 1) get familiar with gas cabinets and purifiers; 2) practice leak checks and conduct contamination root‑cause analyses; 3) maintain process recipes.
Metrology and instrumentation — You’ll design or validate flow sensors and calibrate instruments used on production lines. Example: at a calibration lab you’ll generate a known 500 sccm reference flow and verify sensor linearity across 10 points. Steps: 1) learn reference standards and uncertainty budgets; 2) perform multi‑point calibrations; 3) write calibration certificates.
Gas safety compliance — You’ll develop safety procedures, hazard analyses, and emergency response plans tied to gas systems. Example: for a lab using flammable gases you’ll map leak scenarios and size ventilation to keep concentrations below 25% of LFL. Steps: 1) perform HAZOPs and prepare SDS crosswalks; 2) set alarm thresholds and interlocks; 3) train staff on shutoff drills.
Research & development — You’ll prototype novel flow control schemes or study transport phenomena for next‑gen processes. Example: in an R&D group you’ll build a microreactor and vary flow rates from 0.1 to 10 mL/min while imaging mixing patterns. Steps: 1) design experiments with controlled flow ranges; 2) collect and analyze data (pressure, composition, yield); 3) iterate hardware or control logic.
If you want my recommendation: start with hands‑on experience (internship or lab work) and one focused project you can show on your resume, like an MFC calibration log, a documented HAZOP, or a process recipe that improved yield by a measurable percent.