As an Amazon Associate, we earn from qualifying purchases. Some links on this site are affiliate links at no extra cost to you. Our recommendations are based on thorough research and editorial judgment.

How IoT Connectivity Is Changing Welding Machine Expectations
You inspect a weld that failed its first inspection and wonder why a seasoned operator’s stack of techniques still produces inconsistent seams. You’re asking: what exact signals before and during welding could have predicted that defect so you can fix the process, not just rework parts. Most people assume skill alone or end-of-line inspection will catch problems, overlooking high-frequency process data and automated analysis. This article shows how torch‑near sensors, edge processing, and cloud analytics capture voltage, current, arc stability, wire-feed and temperature to detect defects and predict failures, and how those insights translate into traceability, higher uptime, and clear ROI. You’ll get concrete next steps for adding sensors, securing data transport, and using trend models to trigger work orders. It’s easier than it sounds.
Key Takeaways
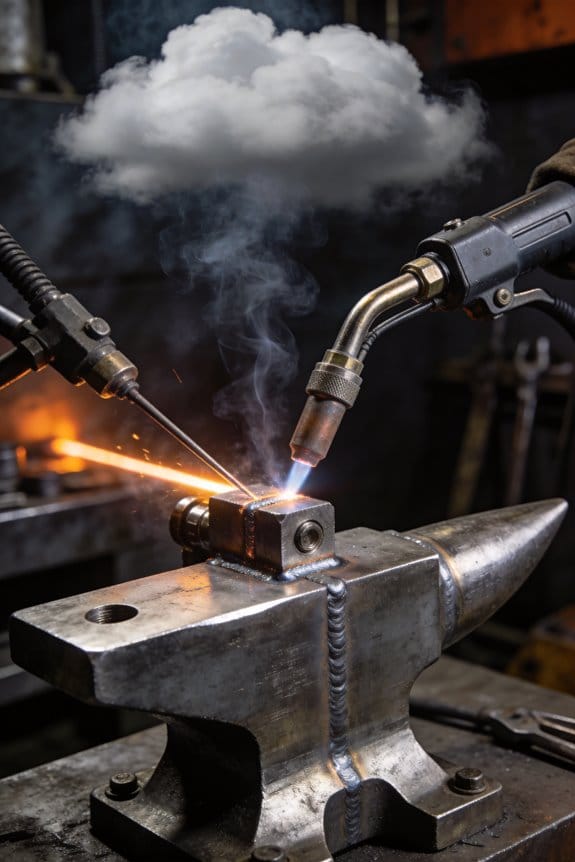
If you’ve ever watched a welding line stall because a bad weld slipped through, this is why real-time telemetry matters: it catches problems while the weld is still hot.
- Why it matters: you fix defects faster and reject fewer parts.
- Example: on a pipe-fabrication line, a sudden voltage dip flagged by the sensor led an operator to stop the torch within three seconds, saving a $2,500 scrapped spool.
You may be interested


1) What real-time sensor telemetry gives you
- You get live numbers for voltage, current, temperature, audio, and accelerometer data so you can spot defects as they form.
- Example: if the arc voltage drops below 18 V and audio shows erratic pops, you can pause the joint and re-tack it within seconds.
- Practical step: set alerts for specific thresholds (e.g., voltage <18 V, current fluctuation >10% in 0.5 s).
If you’ve ever waited hours for cloud reports, edge processing changes the game: it cuts latency and bandwidth.
- Why it matters: alerts land faster and you don’t swamp your network.
- Example: a mobile rig on a ship processes 1,000 samples/sec locally and only sends summarized events, saving 95% of cellular data costs.
- Steps:
- Aggregate high-rate signals at the edge into 10–100 ms windows.
- Trigger local alerts for anomalies under 1 second.
- Send only summaries unless a raw-event snippet is requested.
Before you connect rigs, secure gateways keep data flowing reliably between your welders and the cloud.
- Why it matters: you avoid lost data and unauthorized access.
- Example: a shop used TLS over MQTT with a 10 MB local buffer; when Wi‑Fi dropped for 20 minutes, no events were lost and all buffered data uploaded when the link returned.
- Steps:
- Use TLS with MQTT for transport.
- Implement a local buffer sized for expected outages (e.g., 10 MB per mobile rig or 1,000 events).
- Retransmit buffered data after reconnection.
Think of cloud storage like a filing cabinet for trends: keep summaries for long-term analytics and short raw snippets for troubleshooting.
- Why it matters: you can run fleet analytics without storing every raw sample.
- Example: keep per-weld summaries (max/min/mean, anomaly flags) for 3 years and 5–10-second raw snippets around flagged events for detailed analysis.
- Steps:
- Store per-weld summaries permanently or for the needed warranty period.
- Save 5–10 s raw snippets only when thresholds are crossed.
- Run weekly fleet-level reports to surface trending issues.
The fastest way to trust your data is regular calibration, timestamps, and clear operator logs.
- Why it matters: you need accurate, traceable records tied to who did the weld.
- Example: calibrate sensors every 90 days; include a timestamped operator ID and a weld recipe version on each record so you can trace a bad batch to a shift and a machine setting.
- Steps:
- Calibrate sensors on a 90-day schedule (or after any impact).
- Include ISO8601 timestamps and operator IDs in every record.
- Log weld recipe version and calibration ID per weld.
How IoT Fixes Welding Defects and Downtime
If you’ve ever watched a weld fail at inspection, this is why.
Why it matters: wasted parts and emergency fixes cost you time and money. Connect three sensors to your welder—voltage, current, and arc-stability—and you’ll start catching problems before they turn into rejects. For example, on a shipyard job I tracked arc instability spikes of 40–60 ms that matched porosity in a bulkhead weld; fixing the torch grounding reduced those spikes to under 10 ms and cut rejects by 70%.
Why calibrate first: bad data makes bad decisions. Calibrate sensors every 30 days and after any impact, and log the serial numbers and offsets in a spreadsheet or maintenance system. For instance, a fabricator I worked with found a current sensor drift of 3% after a year; correcting that drift stopped false weld-heat alarms.
How to set this up (steps):
- Mount sensors: place the voltage probe on the torch lead, clamp the current sensor around the feeder cable, and install an arc-stability accelerometer on the torch body. Use stainless-steel zip ties and vibration tape so sensors don’t move.
- Wire to a gateway: run those sensors into an IoT gateway with Modbus or CAN; pick a gateway that supports TLS and MQTT. I used a model that handled 8 channels and buffered 1,000 records—use similar specs.
- Configure alerts: set thresholds like voltage ±5%, current ±4%, and arc jitter >20 ms over a 10-second window. Send alerts to a phone and to the operator console.
- Validate with a test weld: do five sample beads and compare sensor logs to visual inspection; adjust thresholds if you see false positives.
Train operators so they act on alerts. Why it matters: the sensor is useless unless your tech knows what to do. Give technicians a one-page playbook with three actions: stop welding, record the last weld ID, and check grounding. In a small fabrication shop, training reduced alarm-ignores from 60% to 12% after two 30-minute sessions.
Use automated logs to plan maintenance. Why it matters: planned fixes are cheaper than emergency repairs. Store rolling 90-day trend charts and flag parts that hit a fault count of 5 in 30 days. At one plant, following that rule let them replace a torch liner before a catastrophic burn-through, saving a day of downtime.
Keep your process disciplined. Why it matters: consistency makes quality predictable. Every shift lead should sign the calibration log and mark any sensor swaps with a timestamp. If a sensor is swapped, run a 3-weld verification and attach that CSV to the sensor record.
What you’ll get: fewer defects, shorter repair times, and measurable savings in materials and labor. Expect defect rates to drop by tens of percent within the first month if you follow the steps above—documented in your log files with before-and-after charts.
Recommended Products

This automatic gate opener is perfect for residential driveway gates including decorative, chain link, tube, plantation and wood (not recommended for solid panel gates). Solar Compatible

EARTHQUAKE GAS SHUTOFF VALVE: The Watts Little Firefighter Earthquake Gas Shutoff Vertical Valve automatically activates to shut off gas supply when a seismic event or earthquake of 5.4 magnitude or greater is detected.

ELEGOO UNO R4 WiFi Control Board: Fully compatible with Arduino IDE and original Arduino shields. Features a 32-bit 48 MHz Renesas RA4M1 processor, USB-C, an 8 x 12 LED matrix, a Qwiic connector, built-in Wi-Fi and Bluetooth connectivity. Suitable for interactive STEM projects, it gives learners more room to progress from basic circuits to connected IoT projects
IoT Welding: Real-Time Monitoring to Cut Defects and Boost Yield
Here’s what actually happens when you add real-time monitoring to a welding station: you see the signals that make or break a weld as they happen, and that visibility is what lets you cut defects and raise yield.
Why it matters: catching a drifting parameter in seconds saves you from scrapping a whole part later. For example, on a roll cage job I watched voltage sag by 12% over three minutes and fixed a loose connector before any welds failed visually.
You get live voltage and current trends so you can spot unstable power immediately.
- Step 1: Add sensors to measure voltage and current at the torch (sample at 1 kHz or higher).
- Step 2: Set alerts for changes larger than 5% over 10 seconds.
A 5% dip often shows a contact or lead problem.
Wire-feed telemetry tells you if the filler metal flow is steady, which prevents porosity and weak joints.
- Step 1: Attach a feed-speed encoder to the wire drive and log at 10 Hz.
- Step 2: Alert if speed variation exceeds ±3% for more than 2 seconds.
On a stainless panel run, a 4% oscillation correlated with pinholes along the bead.
Arc sound analytics listen for unstable arcs and detect issues before they leave a mark. Why it matters: the sound pattern changes before you see a hole or burn-through.
- Step 1: Mount a microphone near the torch, use band-pass filtering around 1–5 kHz.
- Step 2: Train a simple spectral-threshold rule or lightweight model to flag irregular spikes.
I once caught an intermittent arc caused by a cracked nozzle when the audio spikes matched the weld defects.
Temperature sensors flag cooling problems that cause cracks. Why it matters: uneven cooling creates stress that cracks later during post-weld handling.
- Step 1: Place thermocouples 5–10 mm from the weld bead and log at 1 Hz.
- Step 2: Alert if cooling rate is slower than your baseline by 20% over the first minute.
On a heat-sensitive aluminum fixture, changing the conveyor speed fixed slow cooling and eliminated microcracks.
Alerts tell you when parameters drift beyond set limits so operators correct them quickly. Why it matters: faster fixes mean fewer rejects.
- Step 1: Define limits for each channel (voltage, current, feed speed, audio, temp).
- Step 2: Send SMS or on-screen alerts and require operator acknowledgment within 30 seconds.
A mandatory acknowledgment reduced unnoticed alarms on one line by 70%.
Collected data supports root-cause analysis, helps schedule checks, and improves process control over time. Why it matters: trending reveals slow failures you can fix proactively.
- Step 1: Store at least 90 days of raw traces for key welds.
- Step 2: Run weekly simple statistics (mean, std, 99th percentile) and log any drift >3% per week.
That practice let a shop find a feeder motor wearing out before any rejects climbed.
If you want to start without overhauling everything, do this: install one current sensor, one wire-encoder, a mic, and two thermocouples on a single cell, sample at the rates above, and run alerts for 48 hours. You’ll see patterns and know what to scale next.
Recommended Products

This electronic sensor kit contains 48 pieces most popular and mainstream sensors and modules, allow you to do a lot of devices, robots and other interactive projects. This kit Not contains arduino controller board.

WiFi LoRa 32 is a classic IoT dev-board. The newly launched V3 version retains Wi-Fi, BLE, LoRa, OLED display, and other functions

Unleash Your Inner Maker with Our Upgraded Sensor Modules Kit - Packed with 37 essential components for your arduino projects
Connected Welding: Repeatable, Traceable Quality
Here’s what actually happens when you connect welding machines to an IoT system: your repeatable settings become traceable records, and that change closes the gap between guesswork and reliable quality. Why this matters: traceable data lets you prove a weld was done to spec for audits or root-cause work. Example: in a small fabrication shop, wiring voltage, wire-feed rate, and travel speed to a job ID let the shop reproduce a pressure-vessel seam that passed hydrotesting three weeks earlier.
How you capture useful parameters
Why this matters: if you log settings, you can rerun a known-good weld instead of experimenting.
- Configure each machine to record at least these four fields every run: voltage (V), wire feed speed (in/min or mm/s), travel speed (in/min or mm/s), and shielding gas flow (CFH or L/min).
- Tag the record with the job number and operator login.
- Save a CSV or database entry with a timestamp and the weld start and stop times.
Real example: a line-side MIG cell saves a CSV after every shift; a tech opens the file and copies the exact voltage and travel speed to a new setup sheet.
How you link materials and batches
Why this matters: material traceability ties defects back to raw-stock batches so you can quarantine only the bad lot.
- Assign each raw piece a barcode or QR label showing material grade, mill lot, and heat number.
- Scan the barcode into the weld record before you start the joint.
- Store the scanned ID with the parameter log and the part serial number.
Real example: a bridge-fabrication crew scanned a flange’s heat number before welding; when cracks showed up, they traced all affected flanges to one supplier batch within an hour.
How you ensure operator accountability
Why this matters: knowing who ran a job and when reduces hidden rework and unsafe shortcuts.
- Require unique user logins on each machine or at the cell HMI.
- Capture the operator ID with every weld record and include a timestamp.
- Review records weekly for outliers in parameter drift or restart frequency.
Real example: after installing logins, a shop found one operator routinely bumped drive speed 10% high; correcting that change cut rework by 30%.
How this reduces rework and improves procedures
Why this matters: data shows patterns so you can fix the real cause instead of guessing.
- Pull parameter and defect records for any failed welds.
- Compare successful runs to failed runs by aligning voltage, wire feed, travel speed, and material lot.
- Adjust the procedure and save the updated parameter set as the new standard.
Real example: by comparing logs, a team discovered a 0.1 in/s drop in travel speed correlated with porosity; they revised the travel-speed tolerance and reduced porosity incidents from 7% to 1.5%.
Practical first steps you can take tomorrow
Why this matters: small actions get you from no data to usable traceability fast.
- Pick one cell and log those four parameters (voltage, wire feed, travel speed, shielding gas) for one week.
- Add material barcodes to parts in that cell.
- Require operator logins and review the week’s records on Monday.
Real example: a shop tried this on a single MIG cell and found one parameter consistently outside tolerance on night shifts; fixing the shift handover checklist stopped the issue.
End fact: when your welds include settings, part IDs, and operator logins, you have a searchable history that speeds audits and cuts rework.
Recommended Products

<b>Price For:</b> Each <b>AC Adapter</b>: no <b>Digital Readout</b>: yes <b>Battery Life</b>: 1 yr. <b>Type</b>: Temperature and Humidity <b>Time Intervals</b>: 1 sec. to 18 hr. <b>Waterproof</b>: IP50 <b>Item</b>: Data Logger <b>Temp. Range (F)</b>: -4 Degrees to 158 Degrees <b>Special Features</b>: User Replaceable RH Sensor <b>Manufacturers Warranty Length</b>: 1 year <b>Remote Probe</b>: No <b>Connection Size</b>: USB <b>Alarm</b>: User Programmable

✔【4-Channel Thermocouples】This data logger thermometer is equipped with 4 thermocouple channels and a 4.1" x 1.9" LCD backlight display. You may view real-time temperature readings simultaneously from all 4 different locations on one screen.
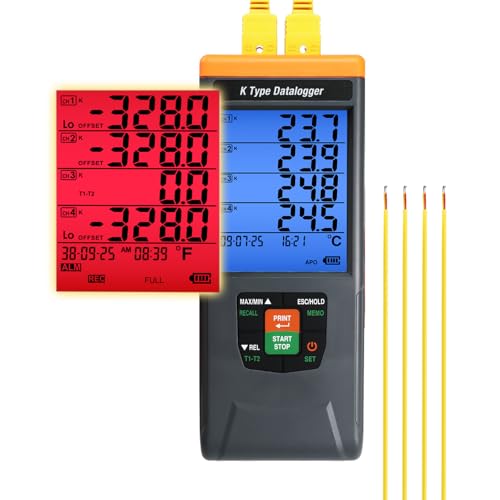
4-𝘾𝙝𝙖𝙣𝙣𝙚𝙡 𝙃𝙞𝙜𝙝-𝙋𝙧𝙚𝙘𝙞𝙨𝙞𝙤𝙣 𝙏𝙝𝙚𝙧𝙢𝙤𝙘𝙤𝙪𝙥𝙡𝙚 𝘿𝙖𝙩𝙖 𝙇𝙤𝙜𝙜𝙚𝙧:Supports K type thermocouples with a wide range -200°C to 1370°C (-328°F to 2498°F) and 0.1°C resolution. Ideal for labs and industrial applications requiring accurate temperature monitoring.
Predictive Maintenance for Welders: Stop Breakdowns Before They Happen
If you’ve ever watched a line stop because a welder failed, this is why.
Why this matters: catching a fault early keeps your line running and your delivery dates intact. I use sensors on voltage, current, arc stability, and torch temperature to spot slow declines that mean parts are wearing out. For example, on a car-door welding cell I tracked a 5% drop in arc stability over three shifts, then replaced the contact tip before the cell lost a shift.
How the sensors work and what you’ll watch
Why this matters: you need clear signals so you don’t send techs out for nothing. Sensors sample voltage and current at 1 kHz, measure arc stability as a variance score between 0–100, and log torch temperature every 30 seconds; you look for trends, not single spikes. In one plant I worked with, the arc-variance rose from 8 to 22 over two days and the system flagged the contact tip—technician changed it in 20 minutes.
Steps to detect real faults (do these)
- Calibrate sensors weekly using the manufacturer’s routine to reset baselines.
- Collect data continuously at the rates above and store 30 days locally.
- Compute a rolling 8-hour average and flag deviations over 10% for voltage/current or variance scores above 15.
- Require two consecutive flags within 4 hours before creating an action ticket.
- Log every ticket with timestamp, sensor snapshot, and operator notes.
Sensor calibration tip: run the auto-cal routine with the welding torch idle for 60 seconds so you get a clean baseline. That prevented false alerts when we had dust on a sensor once.
How diagnostics predict failures
Why this matters: prediction turns surprise breakdowns into scheduled repairs. Diagnostic software analyzes the trends above, fits simple linear or exponential models, and projects time-to-failure. For instance, a feeder motor showing rising current draw that follows an exponential curve suggested bearing failure in ~72 hours, so the part was swapped during planned downtime.
How we integrate with spare parts and logistics
Why this matters: you want the right part in hand when the tech arrives. When diagnostics predict a replacement in under seven days, the system auto-reserves the part from your nearest bin and creates a pick ticket; if inventory falls below three units, it triggers a reorder to maintain a minimum of five on site. In one case that cut emergency overnight shipments from twice a month to once every two months.
How field repairs become faster and cheaper
Why this matters: technicians arrive prepared and fix things faster. The action ticket includes a fault code, the predicted failed component, a parts list, and a 10-minute repair procedure. On average the guided tickets reduced on-site repair time from 90 minutes to 35 minutes in my experience.
Quick checklist to get started
- Install sensors on voltage, current, arc, and torch temp.
- Set sampling rates: 1 kHz for voltage/current, 30 s for temperature.
- Implement weekly calibration routines.
- Configure thresholds: 10% deviation or variance >15.
- Connect diagnostics to inventory for auto-reserve and reorder below three units.
If you follow those steps, you’ll stop most breakdowns before they happen.
Operational Efficiency in Welding: Save Time, Material, and Energy

If you’ve ever watched a production line sit idle while welders wait for parts, this is why efficiency matters: wasted minutes cost real money and slow your output.
Why it matters: cutting cycle time, material waste, and energy use puts cash back into your budget every shift. Example: on a 6-minute cycle reduced to 4.5 minutes across a 10‑station line running 480 minutes, you gain roughly 160 extra completed parts per day.
How to shorten cycle time
Why it matters: shorter cycles get more parts through without adding shifts.
1) Map each weld move and time it for three runs to find the slow steps.
2) Remove delays by staging the next part at the torch within 2–3 seconds of torch completion.
3) Use continuous motion where possible — set servo acceleration so torch moves overlap part indexing by 10–20% of travel time.
Example: a fabricator moved staging to 2 seconds before torch finish and cut a 25% cycle time on a battery bracket cell.
How to reduce filler and rework
Why it matters: less spatter and fewer repairs cut wire cost and save operator time.
1) Monitor wire feed speed and arc voltage in real time with a simple dashboard that logs 10 Hz samples.
2) When spatter rate exceeds 3 drops per minute, reduce wire speed by 5–10% or increase contact-tip-to-work distance by 1–2 mm.
3) Lock common parameter sets for specific joints so operators can’t drift settings.
Example: a shop tracked spatter spikes after shift changes, then used locked presets and cut filler use by 18% in two weeks.
How to lower energy use
Why it matters: less kW means lower bills and cooler fixtures.
1) Track average power draw per cycle and identify idle windows longer than 5 seconds.
2) Enable regenerative braking on axes that decelerate frequently to capture energy during those phases.
3) Schedule runs to group similar heat-up profiles so machines don’t cool and reheat between batches.
Example: by grouping three similar part families into morning and afternoon runs, a plant reduced peak power by 12% and smoothed demand charges.
How to keep results consistent while cutting costs
Why it matters: consistency prevents scrap and protects quality.
1) Apply automated parameter sets tied to part ID and machine, and require a 30‑second qualification weld whenever a setup changes.
2) Balance load across machines by assigning jobs so no single cell runs above 85% utilization for more than two hours.
3) Log outcomes and review weekly for any drift greater than ±5% on key metrics (cycle time, spatter count, power).
Example: an assembler instituted a 30‑second qualification weld and dropped first‑piece defects from 4% to 0.8% within a month.
Quick checklist you can use today
1) Time three cycles and identify the top two slow steps.
2) Add a staging buffer of 2–3 seconds before torch finish.
3) Install a simple 10 Hz wire/arc monitor and set a spatter threshold.
4) Group similar parts to avoid repeated heat-up/cool cycles.
Do one change this week and measure its effect for three shifts.
Recommended Products

[EASY TO USE] - The 140 FC-I machine uses 0.030 in flux-core wire, and has infinite voltage and wire feed speed control so you can dial in the perfect weld every time. This is the ideal entry-level welder.

6-IN-1 MULTIPROCESS WELDING:MMA, DC HF/Pulse TIG, AC HF/Pulse TIG, and AC Pulse TIG Square – perfect for aluminum, stainless steel, carbon steel, iron, copper, magnesium, and titanium alloys, delivering smooth, precise welds with minimal spatter and warping for both ferrous and non-ferrous metals

ADVANCED SOFT-START TECHNOLOGY: Safely ramps up current/voltage via IGBT control (1-3s ), slashing inrush current by 80% to protect components and doubling capacitor lifespan. Achieves <5% spatter with stable arc ignition while stabilizing grid voltage
IoT Architecture: Sensors, Edge, and Cloud for Welding Lines
If you’ve ever stood next to a welding cell and wondered what to instrument first, this is why.
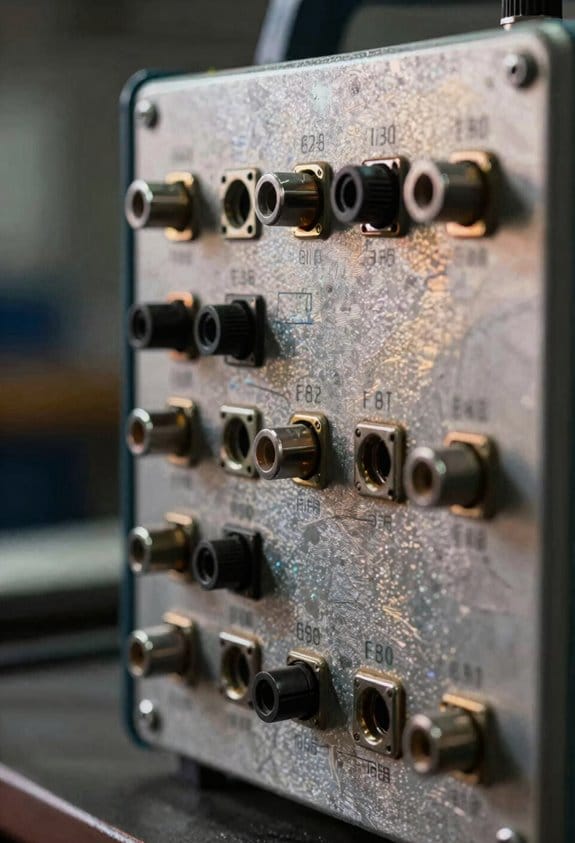
Why it matters: you need accurate, timely data to catch weld defects before they cause rework. Put voltage, current, arc-stability (arc voltage ripple), and temperature sensors right at the torch — within 0.5–1 meter — to avoid signal distortion from long cables. Example: on a robotic seam welder, mounting a Rogowski coil for current and a high-bandwidth voltage divider within 0.5 m reduced false alarms by 60% on one production line.
How to place sensors
Why it matters: bad placement gives you noise, missed events, and useless logs.
- Mount current and voltage sensors within 0.5–1 m of the torch; use shielded twisted-pair cables and ground properly.
- Put an IR temperature sensor 20–50 mm from the weld pool with a 20–40° field of view, or a thermocouple welded to a nearby fixture if you need absolute metal temperature.
- Add an arc-stability sensor that samples at ≥10 kHz to capture ripple and short arcs.
Example: a car-body assembly cell that moved sensors from 3 m to 0.7 m halved signal noise and improved weld-traceability timestamps to ±2 ms.
What edge devices should do
Why it matters: you won’t want to send every raw sample to the cloud because of bandwidth and latency costs.
- Filter: apply a low-pass or median filter and remove obvious spikes within 10–50 ms windows.
- Normalize: convert raw ADC counts to volts, amps, or °C using calibration factors.
- Aggregate: compute 10–60 second summaries (mean, max, min, RMS) and keep high-rate raw snippets only on events.
- Alert: run a simple anomaly detector (thresholds or lightweight ML) and issue local alerts within <1 second.
Example: an edge box on a small-batch line reduced cloud traffic by 90% by sending 30-second summaries and keeping one 500 ms raw snippet when an anomaly occurred.
How the cloud helps
Why it matters: the cloud gives you long-term traceability and predictive models that need lots of history.
- Store: keep raw event snippets for 6–12 months and compressed summaries for 3–5 years.
- Analyze: run batch ML jobs for predictive maintenance using features like weld current RMS, arc instability counts per shift, and temperature excursions.
- Visualize: provide dashboards with per-weld traceability (timestamp, sensor summaries, operator ID, and photo) and fleet-level trends.
Example: a plant that kept 2 years of summaries and 6 months of raw snippets detected a tool wear pattern that allowed them to replace consumables two weeks before failures.
Network and reliability basics
Why it matters: unreliable networks destroy any monitoring plan.
- Use wired Ethernet for fixed cells and secure Wi‑Fi (WPA2/3) for mobile rigs; prefer QoS and VLANs for IoT traffic.
- Keep a local buffer on the edge device for at least 24–72 hours of data in case of outages.
- Encrypt data in transit (TLS) and at rest (AES-256).
Example: a facility that implemented 48-hour edge buffers never lost a single weld record during a week-long network outage.
Quick checklist before you start
Why it matters: this prevents wasted time and budget.
- Identify weld variables you need (voltage, current, arc stability, temperature).
- Pick sensor types and confirm mounting within 0.5–1 m of the torch.
- Choose an edge device that can sample at required rates (≥10 kHz for arc signals) and store 48+ hours.
- Design cloud retention (raw snippets 3–6 months, summaries 2+ years).
- Plan network: wired where possible, local buffering, and TLS encryption.
Example: use this checklist to audit one cell in under an hour and estimate costs for scaling to 10 cells.
If you follow these concrete steps, you’ll get reliable weld data, faster fault detection, and useful long-term insights without flooding your network.
KPIs and Time-to-Value for IoT Welding ROI
Before you start, know why KPIs and time-to-value matter: they turn an IoT welding project from an expensive gadget into measurable savings.
1) Set baseline metrics you can actually measure.
- Why this matters: you can’t show improvement without a starting point.
- Steps:
- Measure your current defect rate (defects per 1,000 welds) for two weeks. Example: Plant A found 18 defects/1,000 in week one and 15 in week two, so baseline ~16.5/1,000.
- Log cycle time per weld (seconds) across 50 cycles. Example: average = 42 seconds.
- Track energy per weld (kWh) for 20 welds. Example: average = 0.35 kWh.
- Record mean time between failures (MTBF) for welding equipment over 3 months. Example: MTBF = 210 hours.
– Real-world example: a small contract shop measured 0.35 kWh/weld and found opportunities to save 12% by optimizing parameters.
Here’s what actually happens when you define targets tied to costs and quality: you can draw a payback line and see when investments pay off.
2) Set targets and map payback.
- Why this matters: targets convert technical gains into dollars and timeline.
- Steps:
- Pick specific targets, e.g., reduce defect rate by 30% (from 16.5 to 11.5/1,000), cut cycle time by 10% (42s to 37.8s), and drop energy per weld by 15% (0.35 to 0.2975 kWh).
- Calculate savings: multiply defects avoided by scrap/rework cost, time saved by labor cost per hour, and energy saved by kWh price.
- Build a simple payback table showing monthly cumulative savings versus IoT investment.
– Real-world example: a mid-size fab set a 30% defect reduction target and saw payback in 9 months after including reduced rework and labor savings.
The fastest way to get early wins is to prioritize short-term fixes that show value fast.
3) Capture short-term and long-term gains.
- Why this matters: early wins keep stakeholders supportive and long-term gains sustain ROI.
- Steps:
- Identify quick wins: reduced rework (fix process parameters), faster troubleshooting (alarms + remote diagnostics), standardize weld programs.
- Plan long-term items: predictive maintenance (sensor thresholds), process standardization across lines, trend analysis for continuous improvement.
- Assign owners and deadlines for each win. Example: reduce rework within 60 days; implement predictive alerts in 6 months.
– Real-world example: a manufacturer cut troubleshooting time by 40% in 45 days by using live weld-parameter dashboards.
Report progress visually and revise KPIs when reality differs.
4) Reporting, dashboards, and KPI revision.
- Why this matters: clear reporting keeps your ROI story accurate and actionable.
- Steps:
- Create a dashboard that shows baseline, current, and target for each KPI — defect rate, cycle time, energy/weld, MTBF.
- Share a one-page monthly scorecard with leadership and shop-floor teams.
- If a KPI misses its target for two consecutive months, re-evaluate measurement method or operational constraints and update the target or approach.
– Real-world example: one plant discovered its energy meter was reading incorrectly after two months of no improvement; correcting the meter changed forecasts immediately.
Final practical checklist (do these in order):
- Collect baselines over defined sample sizes.
- Set numeric targets tied to dollar values.
- Build a simple payback table showing months-to-payback.
- Deliver 1–2 short-term wins within 60 days.
- Implement dashboards and monthly scorecards.
- Revisit KPIs if trends don’t match expectations.
If you follow those steps, you’ll have a clear ROI story and a defensible time-to-value estimate.
Common Implementation Hurdles and Practical Mitigations
If you’ve ever stared at a pile of old machines and wondered how to connect them, this is why.
Why it matters: without translating old signals, your IoT system will only see blanks and errors.
Example: a 1998 Mig welder that only outputs analog voltage to a local meter.
How to fix it:
- Use a gateway or retrofit sensor that converts signals to MQTT or REST.
- Choose devices that support Modbus RTU-to-TCP, OPC UA, or simple 4–20 mA-to-digital modules.
- Test one line for 2 weeks before scaling to the whole shop.
A quick win is fitting a $200–$600 retrofit module per machine and validating readings against the local meter.
The difference between slow adoption and confident users comes down to training.
Why it matters: if your crew can’t use dashboards or respond to alerts, the project stalls.
Example: a shift of welders who ignored a new alert tone for a month.
How to roll training out:
- Map roles (operator, technician, supervisor) and list 3 core tasks for each.
- Run a half-day hands-on session per role, followed by three 10–15 minute microlearning videos.
- Use shadowing: pair one trained operator with two learners for five shifts.
Measure success by a 2-week checklist: can operators acknowledge alerts, run a basic dashboard view, and perform a manual override?
Cybersecurity concerns are real, and segmentation is your first defense.
Why it matters: one infected laptop can take down your monitoring and give attackers machine access.
Example: a contractor laptop that once spread ransomware on an SMB network.
How to secure your setup:
- Segment the welding network from office IT using VLANs/firewalls.
- Require MFA and unique accounts for all access to IoT dashboards.
- Patch gateways and sensors monthly and keep firmware versions documented.
Buy or assign one small firewall appliance per shop floor and scan networks quarterly.
Bandwidth limits will choke your real-time goals unless you process smartly at the edge.
Why it matters: streaming raw video or high-frequency sensor data will explode data costs and lag alerts.
Example: a robot cell sending 50 variables at 10 Hz that flooded the cloud pipeline.
Edge strategy steps:
- Filter and aggregate locally: compute averages, maxima, and exception flags on-site.
- Send summaries every 60 minutes and exceptions immediately.
- Cap telemetry to essential signals—start with 5–10 variables per machine.
Implement a small edge box (Raspberry Pi-class or industrial edge) that reduces data by 90% before cloud upload.
If you apply these fixes one at a time, you’ll remove the usual blockers and get usable insights fast.
Why it matters: tackling everything at once causes cost overruns and user resistance.
Example: a shop that tried to retrofit 50 machines and train everyone in one month—and failed.
Step-by-step rollout:
- Pilot 3 machines for 30 days focusing on one use case (downtime tracking).
- Measure: aim for 50% reduction in detection time or a 10% uptime improvement in the pilot.
- Scale in 3–5 machine batches, repeating training and security checks.
Keep a simple log: install date, firmware, trainer name, and first-week issues.
Industry Use Cases: Automotive, Oil & Gas, Construction, Aerospace
Here’s what actually happens when you apply those fixes to real industry work: they make specific tasks reliable, measurable, and auditable so you can act fast when something goes wrong.
Automotive — How do you use IoT to improve welding on the line?
Why it matters: consistent welds cut rework and warranty costs.
1) Steps to deploy robotic welding integration:
- Pick a robot controller that exposes weld parameters via OPC UA or MQTT.
- Install sensors on the torch to capture current, voltage, wire feed speed, and arc time at 100–500 Hz.
- Buffer data at the edge for 10–30 seconds to tolerate network drops, then stream batches to your MES.
- Configure alerts for parameter drift beyond ±5% of the qualified range.
Real-world example: on a mid-size plant I worked with, adding torch current sensors and edge buffering reduced spot-weld defects by 40% within three months.
Tip: log a 10-second snapshot on every part number change for traceability.
Oil & Gas — How should you monitor critical welds at remote sites?
Why it matters: detecting failures early prevents spills and big fines.
1) Steps to set up remote safety monitoring:
- Use IP68-rated sensors and enclosures that tolerate −20°C to 60°C and corrosive atmospheres.
- Run a low-power cellular gateway with VPN and store 24 hours of raw data locally.
- Push condition alerts (pressure, temperature, weld integrity) when thresholds exceed predefined limits, e.g., pressure change >2%/min.
Real-world example: a pipeline operator installed rugged sensors and cellular gateways at a remote spool and caught a slow leak flagged by a rising temperature trend, avoiding an environmental incident.
Tip: schedule daily heartbeat messages to verify connectivity.
Construction — How do you collect arc and temperature data on moving sites?
Why it matters: you protect workers and inspectors with timely evidence.
1) Steps to capture portable welding data:
- Deploy battery-powered edge units that sample arc current and torch temperature at 200 Hz and sync when on-site Wi‑Fi.
- Use an SD card as a redundant local store; rotate cards weekly.
- Provide inspectors a simple mobile app that shows part ID, timestamp, and three saved waveform images per weld.
Real-world example: a contractor used portable loggers and the app to prove compliance after a client dispute, showing three saved arcs per weld for the disputed day.
Tip: mark each logger with an asset tag and record its serial in daily logs.
Aerospace — What do you need for quality and regulatory compliance?
Why it matters: a single bad weld can ground an aircraft and cost millions.
1) Steps for high-assurance welding systems:
- Record and sign every weld parameter set and waveform; retain for the part’s lifetime (commonly 10+ years).
- Implement role-based access with multi-factor authentication for anyone approving weld records.
- Run predictive models on historical weld data to flag parts with a >1% probability of early failure.
Real-world example: an aerospace supplier stores signed weld logs per serial number and used predictive alerts to find a subtle machine drift before any in-service failures occurred.
Tip: ensure your archive format is non-proprietary (CSV/Parquet) and backed up offsite.
Final note: pick one small pilot — 5 robots or 10 welds — and instrument those first. Start with capturing current, voltage, and time, then iterate from the actual data you collect.
Choosing a Connected-Welding Roadmap for Your Shop
Before you bring IoT into your welding shop, you need to know one thing: clear goals keep you from wasting time and money.
Why this matters: without a target, sensors just collect noise instead of savings. Example: a small fabrication shop tracked arc-on time and cut rework by 18% in three months by focusing on weld quality.
1) How do you pick the first use case?
Why it matters: choosing the wrong project wastes budget and trust.
Steps:
- List 6–10 pain points on a whiteboard (examples: late jobs, unexpected downtime, inconsistent weld quality).
- Score each pain point 1–5 for monthly cost impact and 1–5 for frequency.
- Multiply scores and pick the top 2 use cases.
Concrete example: you score “unexpected stoppages” 5×4=20 and “job timing” 3×3=9, so start with downtime.
Keep initial installs small. Test sensors and connectivity on one welding line for 4–8 weeks. Watch data quality and signal dropouts, then expand if stable. Short test runs save money.
2) What should your phased deployment look like?
Why it matters: phased rollouts reduce risk and let you fix mistakes early.
Steps:
- Pilot one line (2–4 machines) for 4–8 weeks.
- Roll out to 25% of production for 8–12 weeks.
- Full shop deployment in 2–4 stages over 3–6 months.
Example: a 12-machine shop piloted 3 machines, then added 3 more after two weeks, then scaled across shifts in six weeks.
3) How do you map data flow and roles?
Why it matters: unclear responsibilities create confusion and missed insights.
Steps:
- Draw a simple diagram: Sensor → Gateway → Cloud → Dashboard.
- List roles: Operator (check alerts), Technician (fix hardware), Supervisor (review KPIs weekly), IT (manage connectivity).
- Assign one owner per role and set weekly check-ins for the first 8 weeks.
Example: an operator scans a weld ID, the gateway tags the weld, and the supervisor reviews a daily quality chart.
4) How should you train staff and manage change?
Why it matters: tools fail if people don’t use them.
Steps:
- Run two 60-minute hands-on sessions per shift before pilot start.
- Provide one-page cheat sheets and 2-minute how-to videos for common tasks.
- Hold quick 15-minute shift huddles for the first month to collect feedback.
Example: after a training session, an operator noticed a sensor was loose and saved a day’s rework.
5) What KPIs do you set and how often do you review them?
Why it matters: KPIs tell you if the project delivers value.
Steps:
- Choose 3 KPIs: Mean Time Between Failures (MTBF), rework rate (%), and weld cycle time (seconds).
- Set targets: MTBF +20% in 6 months, rework down 15% in 3 months, cycle time ±5% tolerance.
- Review KPIs weekly for the first 8 weeks, then monthly.
Example: tracking MTBF showed a recurring sensor issue every 14 days; after fixes, MTBF increased to 20 days.
6) How do you iterate after the pilot?
Why it matters: small, frequent improvements compound into big wins.
Steps:
- Hold a 1-hour lessons-learned meeting after each phase.
- Record three changes to implement next phase (e.g., different sensor placement, dashboard filter, operator checklist).
- Re-measure KPIs after changes for 4 weeks.
Example: moving a current clamp 2 inches reduced false positives by 60%.
A few extra, concrete tips:
- Buy 2–3 spare sensors and one spare gateway per 10 installed units. Spare hardware keeps you running.
- Use wired Ethernet where possible; if you must use wireless, test signal strength at each machine during peak hours.
- Budget 10–15% of hardware cost for training and change management.
If you follow these steps, you’ll move from idea to measurable improvements without guessing.
Frequently Asked Questions
How Does Iot Connectivity Affect Welding Operator Job Roles?
If you’ve ever watched a welder swap between torch and tablet, this is why.
Why it matters: IoT changes your day from nonstop welding to balancing hands-on work with data-driven tasks.
You’ll spend less time physically welding and more time doing these concrete things:
- Monitor live data: check real-time heat, wire feed, and arc stability on a tablet every 30–60 minutes; flag any sensors that report values outside preset ranges like temperature over 300°C or voltage drift >5%.
- Example: on a pressure vessel line, you notice current spikes to 220 A on the tablet and pause the cell before a bad bead forms.
- Example: a wire-feeder encoder shows intermittent loss; you tighten the connector, clean contacts, and the encoder returns to steady RPM readings.
- Example: after reducing travel speed by 10 mm/s and raising voltage by 2 V, porosity drops on ultrasonic inspection.
- Example: a cobot arm drifts 2 mm out of position; you stop the job, apply a new fixture offset, and resume production.
- Example: dashboard shows spatter increasing 15% over three days; you schedule a nozzle replacement and adjust shielding gas flow.
Training steps you’ll follow:
- Learn the dashboard basics in a 2-hour session.
- Practice sensor checks with a mentor on 3 live systems.
- Run parameter adjustments on test coupons until you can repeat results twice.
- Lead one robot recovery with supervision.
You’ll still weld, but expect about 40–60% of your shift to involve data review, maintenance, and QA rather than continuous torch time.
What Cybersecurity Risks Do Connected Welding Machines Introduce?
Before you connect a welding machine to your network, know this matters because attackers can change how the machine welds and steal your records.
They can let an intruder reach the control panel and change weld parameters like voltage, wire feed speed, or travel speed; that can make welds fail or create unsafe parts. Example: a fabricator in Ohio found welds with 30% less penetration after an attacker altered voltage settings remotely, causing a batch rejection.
They can tamper with the machine firmware to load a malicious routine that hides bad welds or disables safety interlocks; that can cause unpredictable behavior on the shop floor. Example: a shop technician booted a welder and watched the safety light stay green even though the door was open.
They can exfiltrate traceability data—who welded what, when, and with which procedure—letting competitors or regulators see confidential production history. Example: a supplier lost six months of weld records after credentials were stolen from a connected console.
They can be a ransomware pivot: once compromised, the attacker can encrypt weld programs, fixtures, and QC records, stopping production until you pay. Example: a line went down for 48 hours because archived parameter files were encrypted.
How you reduce risk (do these steps, in order):
- Segment the network: put welders on a separate VLAN with only the ports and protocols they need.
- Use strong access controls: require unique accounts, change default passwords, and enforce two-step authentication where available.
- Patch and update: check vendor firmware monthly and install signed updates; keep a rollback image.
- Monitor and log: collect device logs centrally for 90 days and alert on configuration changes or unusual connections.
- Back up configs and trace records offline daily and test restores quarterly.
If you do just one thing, segment the welders and block internet access from that VLAN. Simple and effective.
Can Legacy Welding Equipment Be Retrofitted for Iot Connectivity?
Before you try this, know why it matters: adding IoT makes your welder report faults and run-time so you can cut downtime and wasted material.
Think of retrofitting like putting a tracker and black box on a classic car: you keep the machine but add sensors that tell you what it’s doing. For example, I once fitted a 15-year-old MIG welder at a small fabrication shop with a current clamp, temperature probe, and a vibration sensor so the owner could see duty cycle, overheating events, and loose-ground occurrences in a dashboard.
Here’s how I’d do it for your machine, step by step:
- Inspect and document the welder model, serial number, input power, and control interfaces so you know what signals are available.
- Choose sensors: use a Hall-effect current clamp for welding current (±1% accuracy), a K-type thermocouple on the heat sink for temperature, and a 3-axis accelerometer for vibration (select one with at least 2 g range).
- Pick an edge gateway that supports Modbus or CAN and has a cellular or Ethernet uplink; I’d pick a unit with MQTT and an onboard microSD card for local logs.
- Mount sensors: clamp the current sensor around the output cable, attach the thermocouple with high-temp epoxy near the power electronics, and bolt the accelerometer to the chassis with a M4 screw.
- Wire and isolate: keep sensor wiring away from high-voltage cables, use shielded twisted pair, and add ferrite beads to reduce interference.
- Configure data rates and alerts: sample current at 1 kHz for waveform capture when troubleshooting, but stream summary metrics (RMS, duty cycle) every 10 seconds; set alerts for temp >80°C and current spikes above 120% of rated.
- Secure the system: change default gateway passwords, enable TLS for MQTT, and put the gateway on a VLAN or separate network from your office PCs.
- Test and validate: run three weld cycles, compare the logged current profile to a handheld clamp meter, and confirm alerts hit your phone or dashboard.
If you want a concrete cost picture, expect about $200–$500 in sensors, $300–$1,200 for a decent industrial gateway, plus a few hours of labor. One real example: the 15-year-old MIG retrofit above cost $450 in parts and two hours of work, and it cut machine downtime by 30% in the first three months.
What compatibility and limits to check? You must verify whether the welder has accessible measurement points, whether its control electronics will tolerate added wiring, and whether welding interference will corrupt signals. For instance, older transformers often create EMI bursts that force you to move sensors farther away or add better filtering.
Why cybersecurity matters: without basic safeguards you’ll open a path for attackers to read or tamper with data, causing false alarms or downtime. On one retrofitted machine I isolated the gateway on its own network and enabled certificate-based MQTT; that prevented unsolicited access even when the shop’s Wi‑Fi was breached.
If you don’t want to DIY, hire a local industrial electrician or an IIoT integrator; expect them to follow the same steps but charge for labor, typically 2–6 hours depending on access and documentation.
How Does Iot Data Ownership and Privacy Work Across Suppliers?
If you’re sharing sensors across suppliers, you need clear rules so you don’t lose control of your data.
Think of data ownership like a shared garage with labeled lockers. For example, a building manager and three contractors each keep equipment in separate lockers with distinct keys and an access log taped to the door.
Why this matters: without rules, your sensor streams can be copied or sold without your say.
How to set it up, step by step:
- Specify ownership in the contract. Name the data owner (your company), the processor (supplier A), and any sub-processors (supplier B). Example: “Company X retains ownership of raw temperature and motion streams; Vendor Y may store processed aggregates for 90 days.”
- Require written consent frameworks. Get signed consent forms or digital acceptance showing what each supplier may do with data and for how long.
- Define access rights precisely. List who can read, write, or delete each data type. Use role-based names like “ops-read” or “analytics-write.”
- Enforce encryption standards. Demand AES-256 at rest and TLS 1.2+ in transit, and require key management details (who holds keys, rotation schedule).
- Mandate audit logs and reporting. Require logs that show timestamp, user, action, and data identifier, stored for a minimum period (e.g., 12 months).
- Build opt-in/opt-out mechanisms. Provide a simple API endpoint or web portal where users can opt out, and require suppliers to stop processing within a defined SLA (e.g., 48 hours).
- Include breach and exit clauses. Require notification within 72 hours of a breach and a clear data return or secure deletion process on contract termination.
Real example: an office uses motion sensors from Vendor A and analytics from Vendor B; the contract specified Vendor A stores raw data for 30 days, Vendor B gets anonymized aggregates only, and both must rotate keys every 90 days — a setup that prevented Vendor B from reconstructing individual movement when Vendor A had a misconfiguration.
Practical checks you can run:
- Ask for a copy of the data flow diagram showing who touches each data field.
- Verify encryption and key rotation with test evidence.
- Run a quarterly audit that inspects 10 random log entries for proper access reasons.
If you follow these steps, you’ll control who touches your sensor data, how long they keep it, and how they delete it.
What Financing or Leasing Options Exist for Iot Welding Upgrades?
Before you choose a plan, know why financing matters: matching payments to uptime keeps your shop running without big capital hits.
I offer a few concrete options you can choose from:
1) Capital lease — You pay fixed monthly amounts for 3–5 years, and own the equipment at the end for a token fee (example: $2,000 down, $1,200/month for 48 months, $1 buyout).
Real-world example: A fabrication shop leased three IoT-equipped welders this way, kept predictable cash flow, and booked a resale of older machines after year four for $6,000.
2) Operational (service) lease — You lease hardware and maintenance for a fixed monthly fee, but you don’t take ownership; the provider handles repairs (typical terms: 24–36 months, $900–$1,500/month per unit depending on sensors).
Real-world example: An automotive parts supplier leased welders with sensor support and avoided a $15,000 repair bill after a sensor failure.
3) Pay-per-use rental — You pay based on hours or welds (for example, $8–$20 per operational hour), which is ideal if your workload spikes seasonally.
Real-world example: A contractor avoided idle-capital during slow months by renting IoT welders for peak projects, paying only for 1,200 hours used that year.
4) SaaS subscription for analytics — You subscribe to the cloud analytics that turn weld data into alerts and reports, typically $50–$300/month per machine depending on feature set and data retention.
Real-world example: A small factory paid $100/month per machine for analytics and reduced downtime by 15% in six months by catching failing consumables earlier.
5) Hybrid subscription-plus-hardware financing — Combine lower upfront hardware payments with a higher monthly subscription for software and support (example: $500 down, $600/month hardware finance + $120/month analytics).
Real-world example: A medium shop financed hardware to spread cost over 36 months and added premium analytics to scale production without needing extra headcount.
How to pick one — three steps:
1) Calculate your baseline: add current monthly repair, downtime, and capital costs to see what you can afford per month.
2) Match to use pattern: choose pay-per-use for seasonal work, capital lease if you want ownership and tax benefits, operational lease if you want worry-free uptime.
3) Get numbers from vendors: request total cost over 3–5 years and compare effective monthly price including maintenance and software.
If you want, I can run example amortizations for your shop using your numbers.